Zh OpenStreetMap Visualization: Difference between revisions
mNo edit summary |
mNo edit summary |
||
| Line 31: | Line 31: | ||
I don't create new tables, I will use tables from my extension. | I don't create new tables, I will use tables from my extension. | ||
Here my data for Example 1, Example 2 | |||
[[File:Visualization-Data.png]] | |||
| Line 55: | Line 59: | ||
[[File:Visualization-Structure-List.png]] | [[File:Visualization-Structure-List.png]] | ||
For easy way you can press '''Close''' button in toolbar to return to main visualization page | |||
Now we need to create Data Source. | |||
[[File:Visualization-DataSQL-Main.png]] | |||
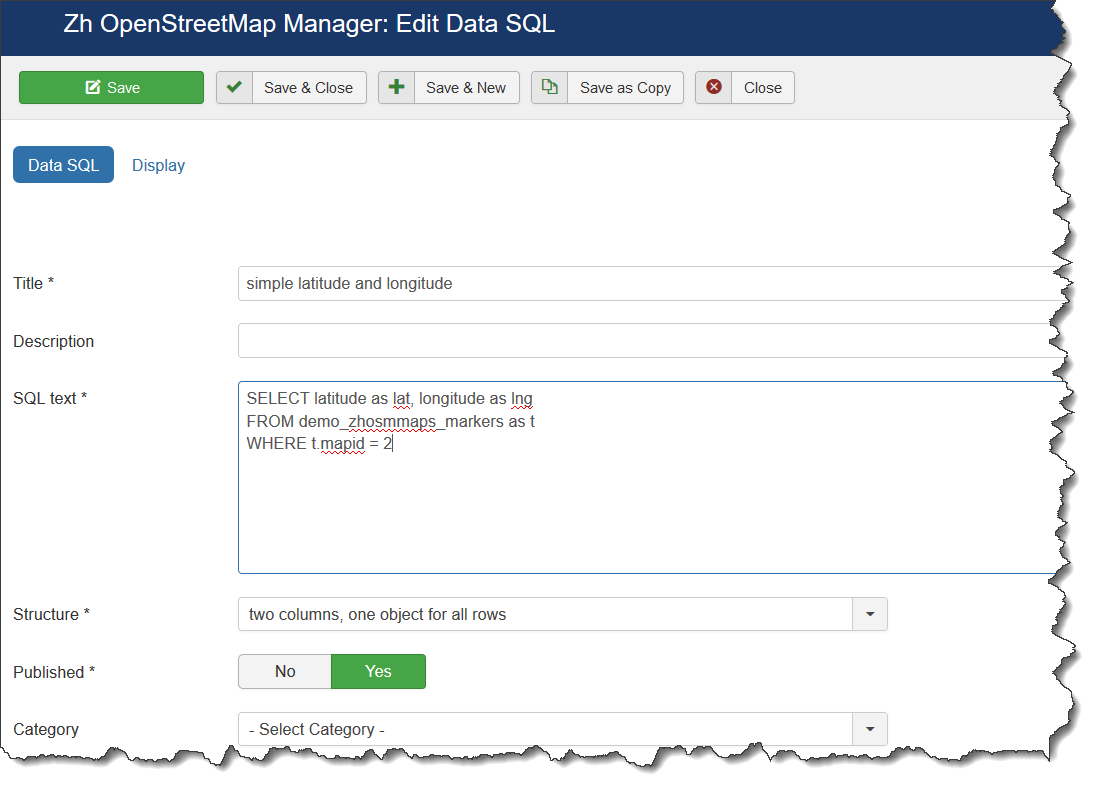
As you can see I use joomla notation for my table. I use table for placemarks, because it contains latitude and longitude in different fields. | |||
I added aliases for my columns, because I describe in Structure names which differ from table column names. | |||
And as you can see in this source I use our Structure. | |||
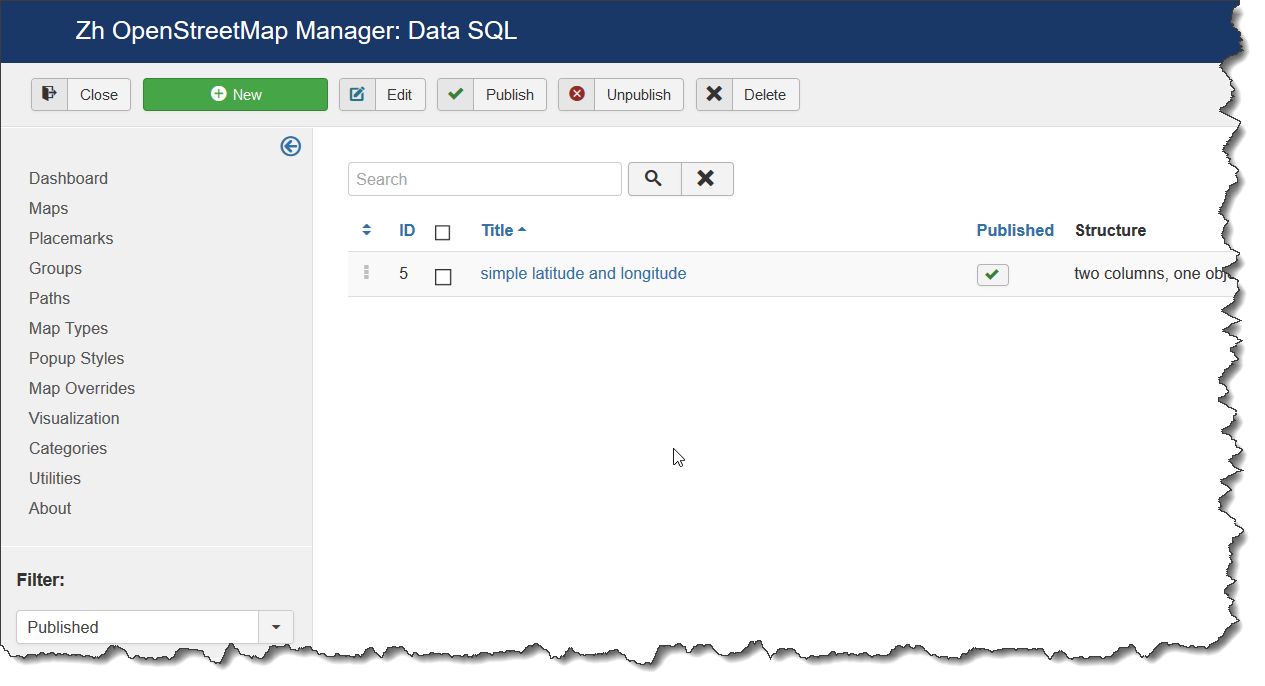
When come back to Data Source list we can see our Data Source | |||
[[File:Visualization-DataSQL-List.png]] | |||
Now lets show this data. | |||
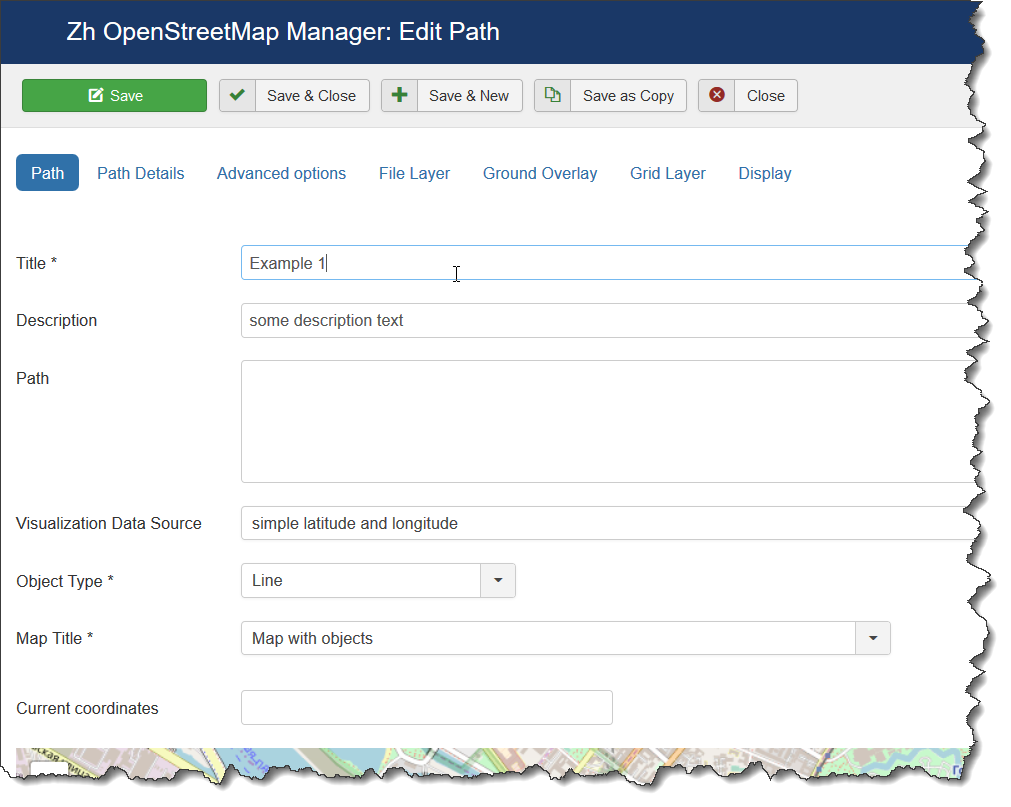
Go to Paths and create new one | |||
[[File:Visualization-Example1-Main.png]] | |||
Here you set '''Object Type''' and '''Visualization Data Source'''. | |||
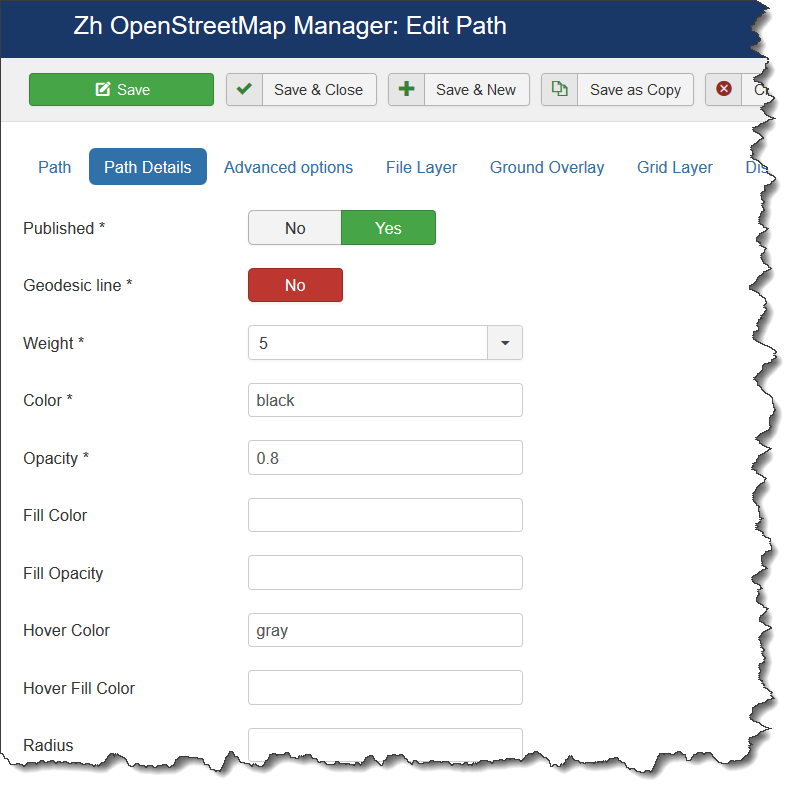
And on details page we need define some attributes to our '''Line''' | |||
[[File:Visualization-Example1-Details.png]] | |||
As you can see I set '''Hover Color'''. | |||
Moreover I enter '''Addition HTML text''', set '''Action by click''' to open popup and other Path properties. | |||
Publish Path and lets check | |||
Main view | |||
[[File:Visualization-Example1-1.png]] | |||
Hover | |||
[[File:Visualization-Example1-2.png]] | |||
Click | |||
[[File:Visualization-Example1-3.png]] | |||
== Conclusion == | |||
As you can see you can easy create visualization, easy control behaviour your map objects. | |||
Structure is separated from Data Source for flexible use, you can create one Structure definition and many Data Sources (with different WHERE clause for main SELECT) | |||
Revision as of 12:13, 13 November 2019
Preface
Use visualization to show data from other data sources (database tables).
To do it you should do next steps:
- create Structure
- create Data Source, assign your Structure
- create Path or Placemark, assign your Data Source
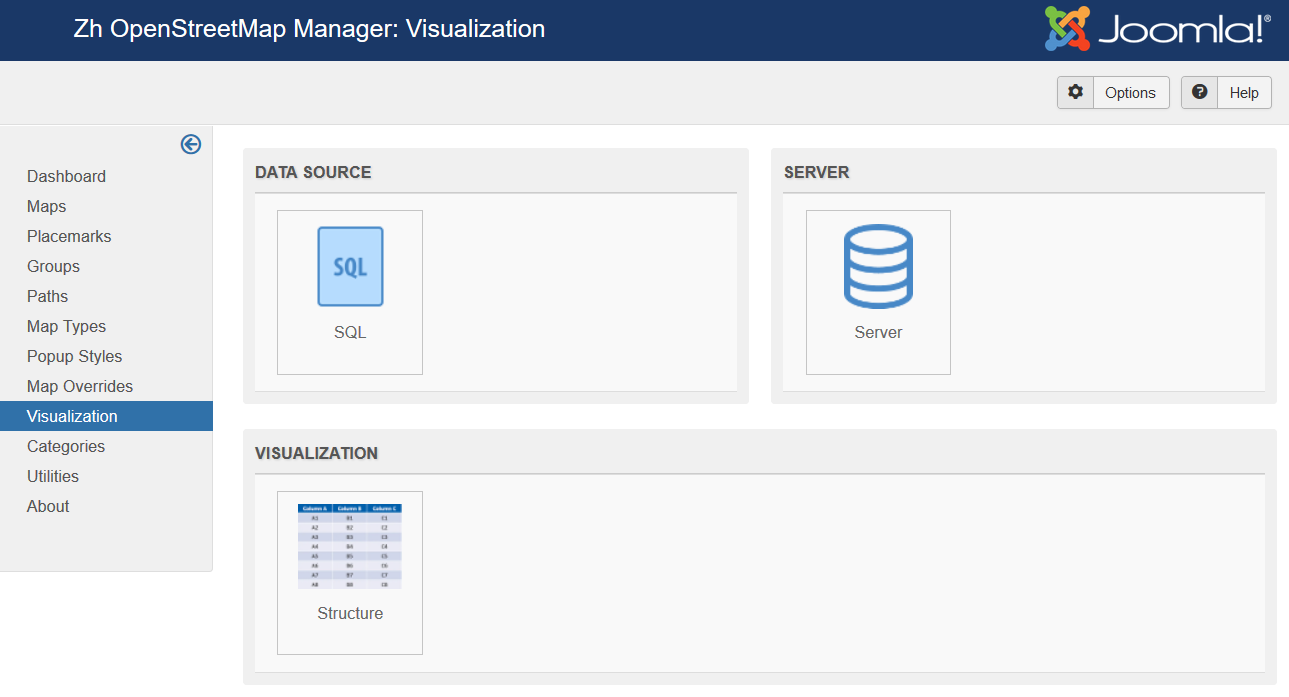
Here you can see main page for visualization.
Structure
In Structure you enter information about your data, ie column names to use from data source, and other attributes.
Data Source
In Data Source you define SQL statement to get data from database.
For flexible use there is only one field for SELECT statement, you can just create it in phpMyAdmin, copy/paste and use it.
You can use for table names as full names, as names in joomla notation (ie starting from #__)
Examples
Lets create a few examples to show how you can use visualization on your site.
I don't create new tables, I will use tables from my extension.
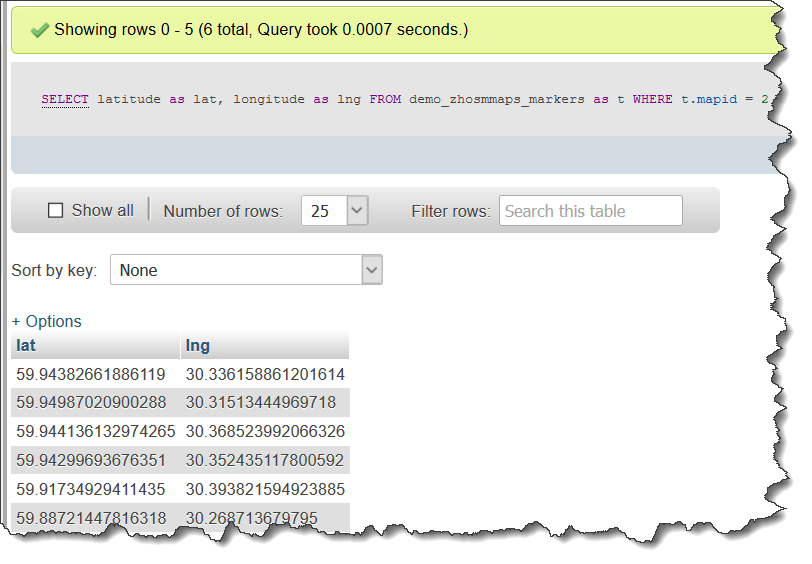
Here my data for Example 1, Example 2
Separate columns for latitude and longitude
Lets create Structure
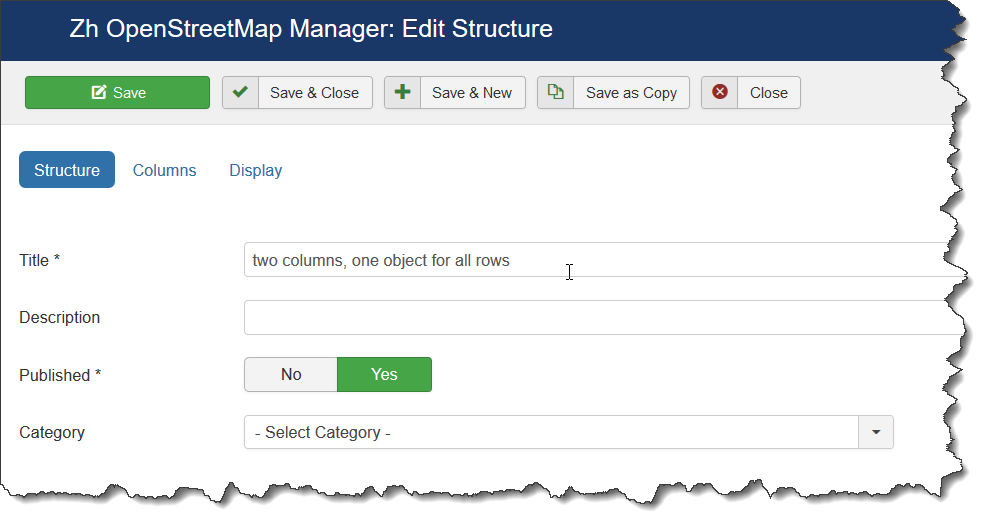
Add main information
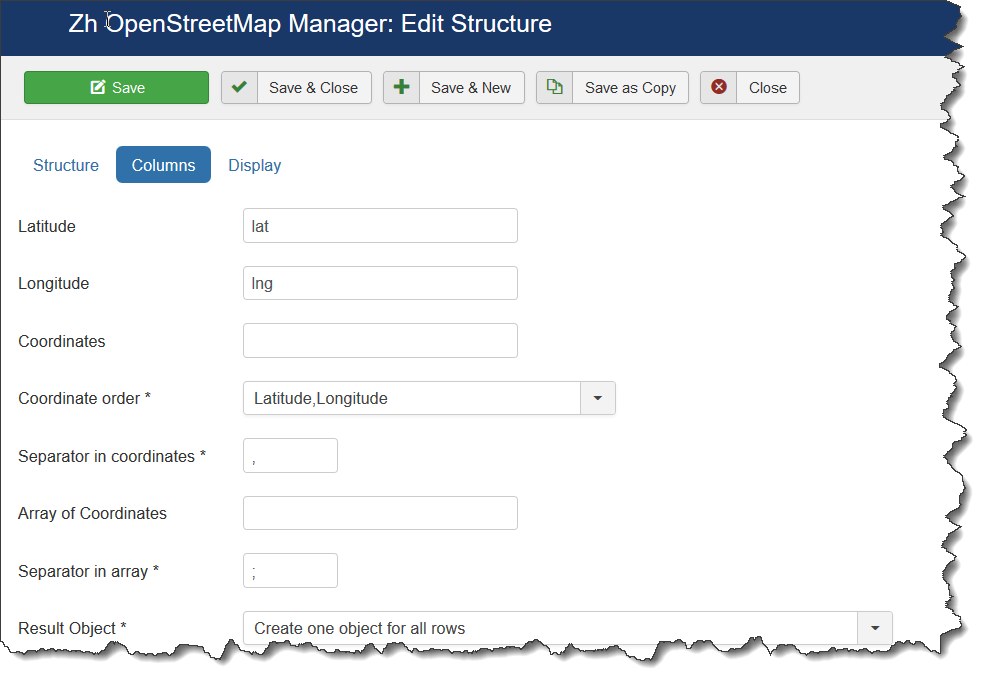
Add columns description
In this example I created structure, which describe that my data will contain two columns - lat and lng.
For this our test example we have to define only two fields.
In other words my SQL will have columns lat and lng
When come back to Structure list we can see our Structure.
For easy way you can press Close button in toolbar to return to main visualization page
Now we need to create Data Source.
As you can see I use joomla notation for my table. I use table for placemarks, because it contains latitude and longitude in different fields.
I added aliases for my columns, because I describe in Structure names which differ from table column names.
And as you can see in this source I use our Structure.
When come back to Data Source list we can see our Data Source
Now lets show this data.
Go to Paths and create new one
Here you set Object Type and Visualization Data Source.
And on details page we need define some attributes to our Line
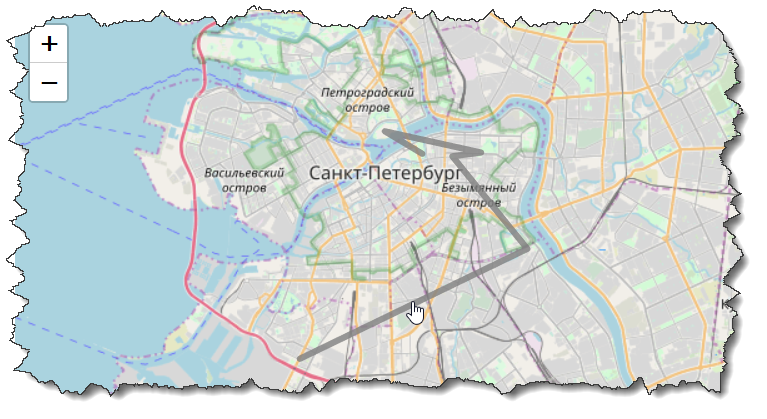
As you can see I set Hover Color.
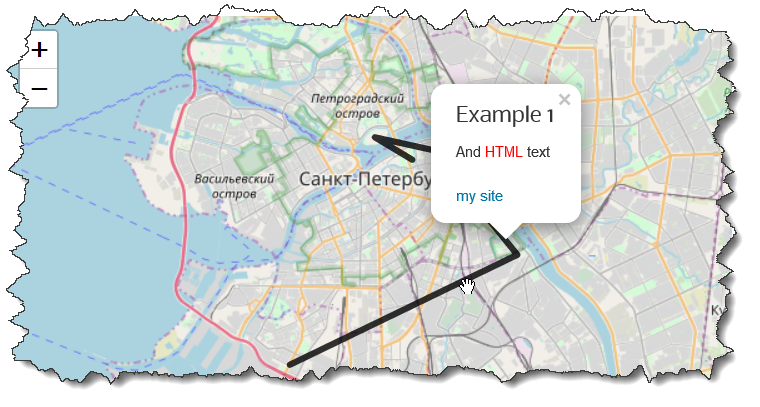
Moreover I enter Addition HTML text, set Action by click to open popup and other Path properties.
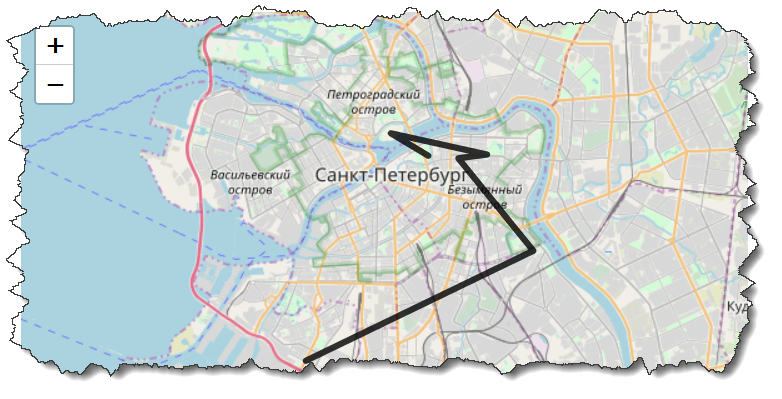
Publish Path and lets check
Conclusion
As you can see you can easy create visualization, easy control behaviour your map objects.
Structure is separated from Data Source for flexible use, you can create one Structure definition and many Data Sources (with different WHERE clause for main SELECT)
